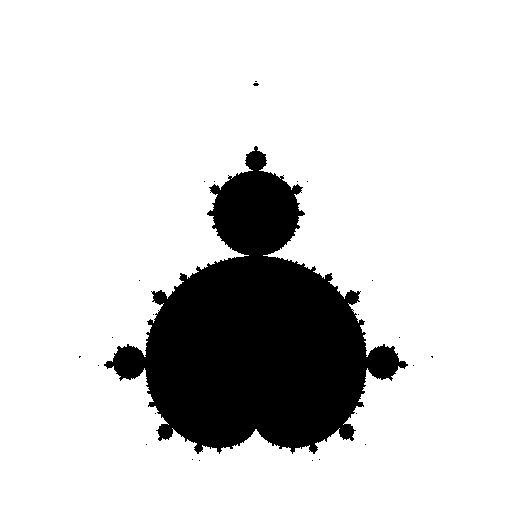
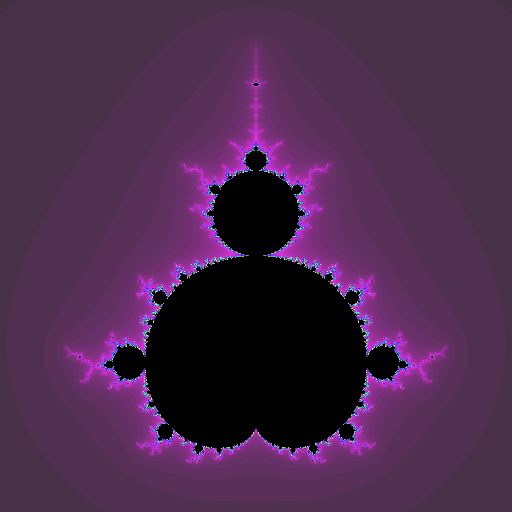
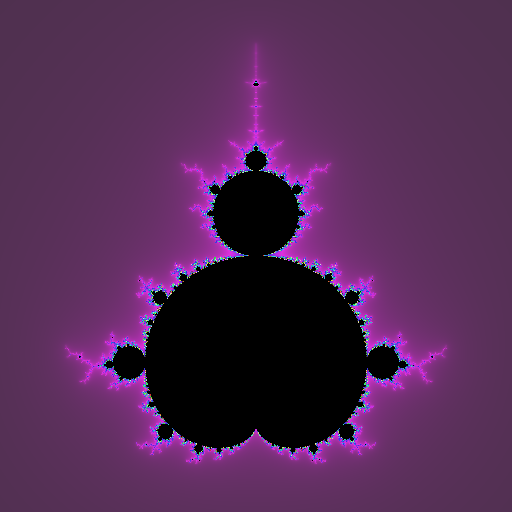
This is a large-scale rendering of the Buddhabrot: 1,048,576 x 1,048,576 pixels (220 on a side, about 1.1 trillion pixels in all), browsable like a map. The switcher in the top right offers three views of the same underlying object: two colorings of the Buddhabrot, and the classic Mandelbrot set.
The Mandelbrot set is a fractal (the
Wikipedia article goes
deep), but put simply: for every point c of the plane, run the formula
z = z² + c over and over, starting from zero. If the value of
z ever escapes past a fixed distance from the origin, c is
outside the set; if it stays bounded forever, it is inside. Painting inside points
black and outside points white gives the first image.
The same data allows for richer pictures. Coloring each outside point by how many iterations it took to escape gives the banded second image. Picking colors from a smoothly cycling palette, and smoothing further by how far past the threshold the value lands, gives the third -- which is exactly the "Mandelbrot" view on the map.
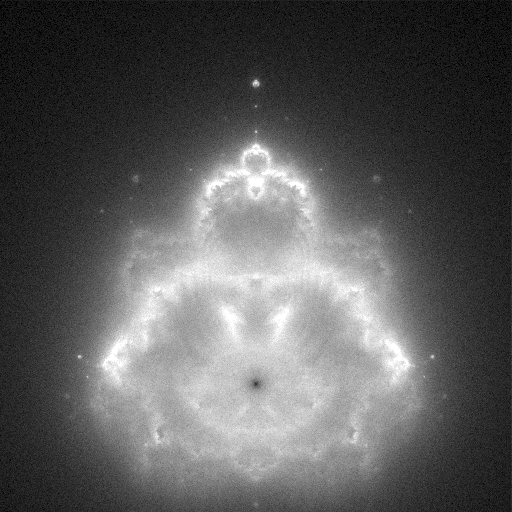
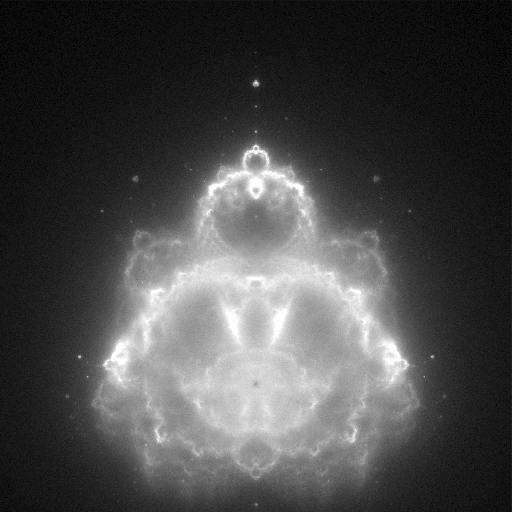
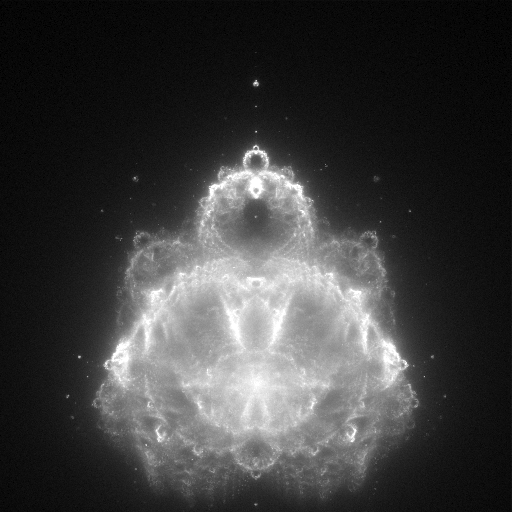
The Buddhabrot is an alternative way of viewing the same iteration. Instead of
coloring c by how quickly it escapes, follow the point z
on its way out and brighten every pixel it passes through. Summing those visits over
trillions of random starting points produces a density image: the Buddhabrot.
One interesting property is that the image depends on how many iterations you are willing to compute before giving up on a point. The three images above allow orbits up to 100, 500, and 10,000 steps -- longer-lived orbits add fine tendrils and haze that short ones never reach.
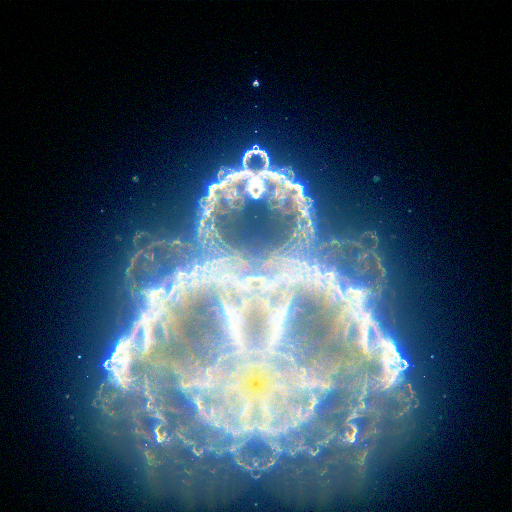
The most common way to color the Buddhabrot is to split the orbits by how long they take to escape and let each group drive one color channel: here the quick orbits (escaping within 100 iterations) draw the blue channel, the middle ones (within 500) green, and the slow ones (within 10,000) red, each channel balanced with histogram equalization. Orbits that survive even longer before escaping show up only in the "Escape Coloring" view. It is the same trick used for false-color astronomy photos, where each channel is a different wavelength of light. This is the idea Melinda Green used to develop her famous view of the Buddhabrot -- you can read more on her website, and many thanks to her for help on rendering the "Traditional" view presented here.
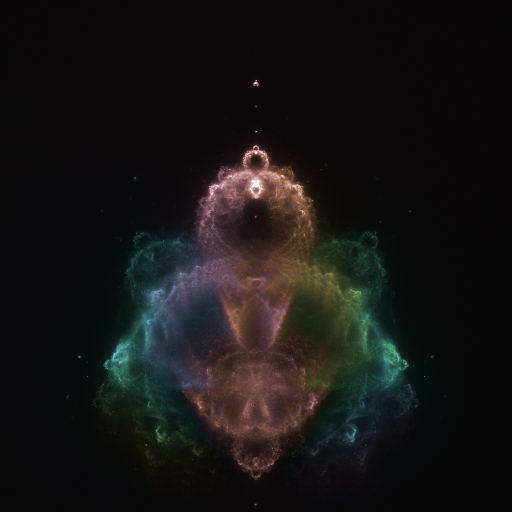
The alternative used for the "Escape Coloring" view sums the value of c
itself into every pixel an orbit touches. The complex argument of each pixel's sum
then picks a hue and its magnitude the brightness, through a palette slightly muted
from a traditional HSV ramp to even out perceptual brightness -- and because I think
it looks better.
The two Buddhabrot views are accumulated at the full 220 resolution from about 140 trillion sample points (1.38 x 10¹⁴) spread evenly over the plane as a low-discrepancy lattice, with each orbit followed for up to 500,000 iterations. The Buddhabrot is mirror-symmetric, so only half the plane is actually sampled: every visit is deposited twice, once at the pixel the orbit passes through and once at its mirror twin (with the summed value conjugated, to keep the Escape Coloring's hues consistent across the axis).
An image this size is far too large to accumulate in memory at once, so it renders
as 128 horizontal bands of 8,192 rows -- and because a Buddhabrot pixel collects
visits from orbits starting all over the plane, every band needs all of the samples,
not just its own share. Rather than redo the whole computation 128 times, a one-time
detection pass finds the 2.1 trillion orbits (about 3%) that escape slowly enough to
leave a mark and caches them in a 1.6 TB index; each band then replays just those
orbits and keeps the visits that land on its rows -- about 270 trillion orbit traces
in all. The work ran on two identical GPU machines sharing a queue of bands, either
of which produces bit-identical tiles. The Mandelbrot view is far cheaper -- each pixel
there depends only on its own point c -- and was rendered directly at
the same resolution.
The result is about 16.8 million 256-pixel tiles per view plus their zoom pyramid. The full-resolution tiles are packed into small block archives that the viewer unpacks itself with byte-range requests, and the map is drawn by OpenSeadragon.
The sample images on this page were generated at small scale by the same coloring code as the full render.
-- Scott Seligman